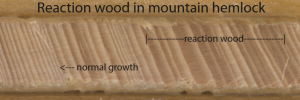
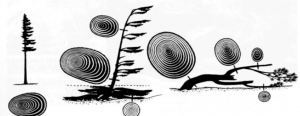
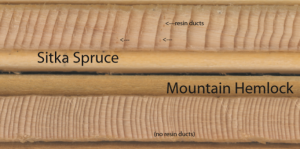
This post will be an update from my first post about this summer’s research. Thus far, we have been able to collect tree ring cores and the information about the trees from the TRAYLS group. We have created the Google Earth interactive site that houses this information and is accessible to anyone. We have also added other tree information from Lauren Oakes’s study site and Pleasant Island. We are working on adding data points from Ben Gaglioti’s study site at La Perouse Glacier.
The cores arrived in the mail and were mounted and sanded. The samples came from mountain hemlock and Sitka spruce trees. We were able to create graphs from the data and do some comparing between tree species.
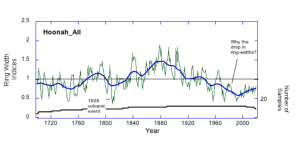
In graph 1, the blue line rises to its highest peak around 1880. This means that the rings indices is at the highest point. The tree rings would be thickest indicating the most growth would be happening during this time in all of the overlapping samples.
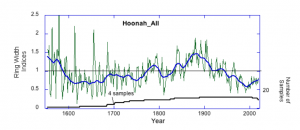
In graph 2, the blue line rises to its highest point at about 1900. After this, the line takes a nosedive and drops continuously till 2000. From both graphs, we can speculate what the past environments could have been like. This work is important because it has rarely been studied before. This work can be added to the known information about Alaskan Trees and the history of the area.
